How does Solar Wizard work?

How does Solar Wizard work?
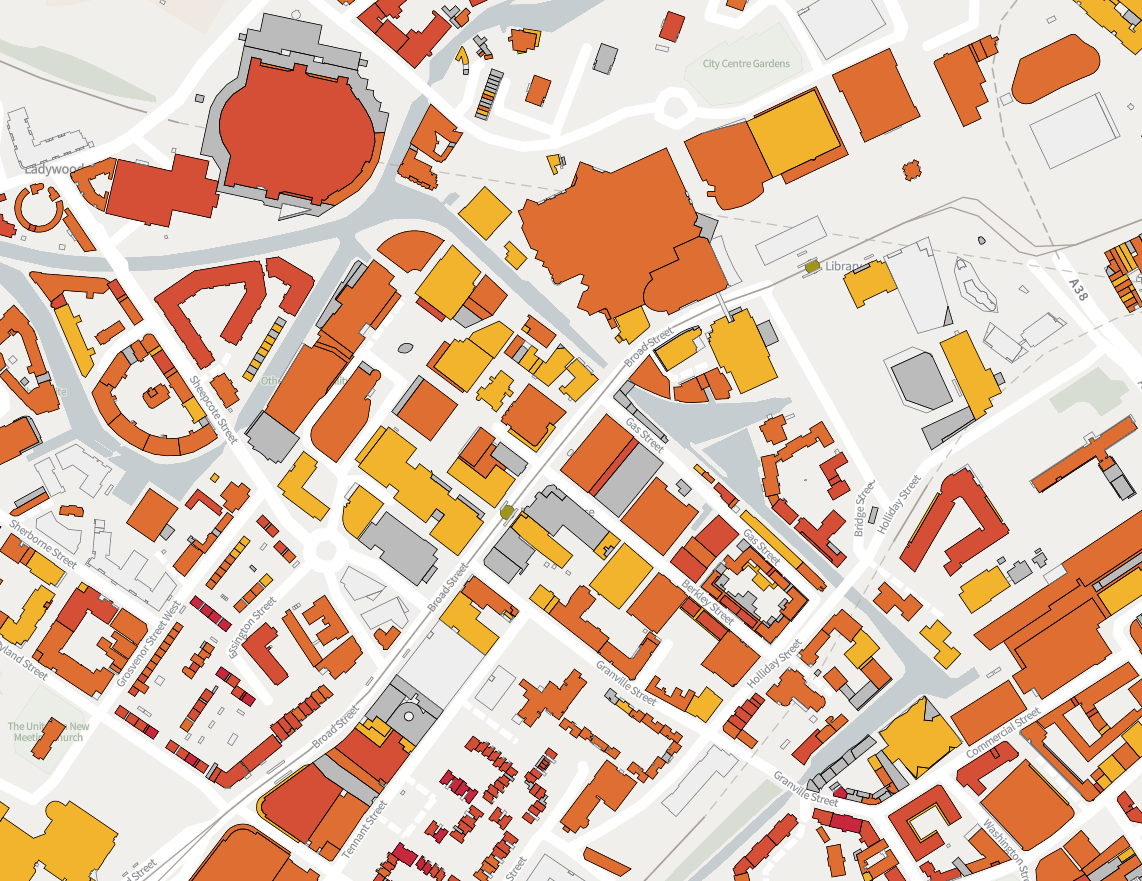
Solar Wizard uses a number of different datasets to model the shape of your roof and of the buildings and landscape features nearby, and it uses this information to estimate how much solar energy would reach each part of your roof throughout the year. Costs and savings are estimated using statistics from real-world installations and benchmark figures.
Calculation of rooftop solar PV potential is complex, requiring multiple stages. These stages can be summarised as follows:
- Model horizons: using the LiDAR data, the model builds a horizon profile for each point of LiDAR data that falls within the footprint of a building. This is the horizon height in degrees from horizontal in a ring around the building, as if an observer was standing on the roof of the building and reporting how much sky could be seen in each direction.
- Detect roof planes: For each building, the model detects the various roof planes that make up the roof of the building using a modified version of the Random Sample Consensus (RANSAC) algorithm. For example, it would detect one roof plane in a flat-roofed building, two in a building with gables, and four in a building with a hip roof. The higher resolution the LiDAR is, the more accurate this process is. This tells us the size and compass orientation of each potential PV panel site.
-
Exclude unsuitable roof sections:
- they are too North-facing,
- they are angled too steeply,
- they are too overshadowed to the South, South-East or South-West (using the horizon data calculated earlier),
- the roof section is too small for a useful installation.
- Calculate PV energy output: Using an open-source software tool called PV-GIS, the PV energy output of an installation with a given location, size, compass orientation, and horizon model is calculated. This includes modelling losses due to temperature, reflection, solar spectrum, and cabling/inverters.
- Perform cost-benefit analysis: The NPV (net present value) and IRR (internal rate of return) are calculated for each potential PV installation of each building. For example, if a building has 3 potential PV sites on its roof called P1, P2 and P3, in descending order of energy out-put per square metre, the NPV and IRR are calculated for the following installations: [P1], [P1 P2], and [P1 P2 P3]. This is so the worst site (P3) is only considered if it would be worth installing both P1 and P2.
How reliable are the results?
Solar Wizard's outputs are modelled and therefore cannot be absolutely accurate in every case, however we have taken a number of steps to ensure that the estimated figures are as good as we can make them.
Our model has been continuously developed over several years and has been used as part of a number of CSE’s energy strategy consultancy projects for local authorities. This means that instances where the model has previously produced incorrect or non-optimal outputs have already been identified and corrected. Each time this occurred we have improved the model and added a test to our regression test suite which ensures that the problem cannot re-occur in the future. Each stage of the model has its own suite of regression tests which has been built up over time. The final model outputs were validated against monthly kWh outputs of real-world PV installations taken from pvoutput.org, and user testing was carried out as part of the development process.
As part of our approach to software development, we have followed industry best practices, such as version control, code reviews, automated software linting and static analysis, upkeep of an automated test suite of unit tests, integration tests and regression tests, continuous integration, and software dependency vetting.
Most of the datasets we use are openly available and all of them come from reputable sources, such as the Environment Agency, the Microgeneration Certification Scheme (MCS) and Ordnance Survey.
You can read about the limitations of the model here.


